.png?width=500&height=95&name=CQ%20and%20ClearQuery_Blue%20Boarder%20with%20CQ%20Branding%20(1).png)
Task 1
Navigate to the Dashboards:
Step 1:

Task 2
Click "New Dashboard," then provide a name and assigned ownership rights then click "Create":
Step 1:

Step 2:

Task 3
Click the dashboard that was just created:
Step 1:

Task 4
To get started with a new dashboard, the user will need to have charts previously saved, this was a task in Module 2. If you have not completed that module or you did not save any charts when it was completed, please navigate to Automated Insights or Ask ClearQuery to save a few charts before continuing.
Task 5
Add charts to the dashboard by clicking "Add Chart," select the chart you wish to add from the dropdown, click "Add." Repeat until there are several charts on the dashboard:
Step 1:
Step 2:
Step 3:
Task 6
Once you have added a few charts you can adjust the size or placement by clicking on the arrows with in the chart menu.
Charts can be either one fourth, half, or the full width of the dashboard.
Examples:


Task 7
Locate the chart commenting function by clicking on the speech bubbles located at the bottom of one of the charts, click the icon.
Step 1:

Task 8
Add a comment to a chart and save it. The user can tag another user in their organization within the comment for them to come look at later. To do this type the "@" symbol then locate the username of the person you wish to tag.
Note: the tagged user will receive an email alerting them of the comment.
Step 1:

Task 9
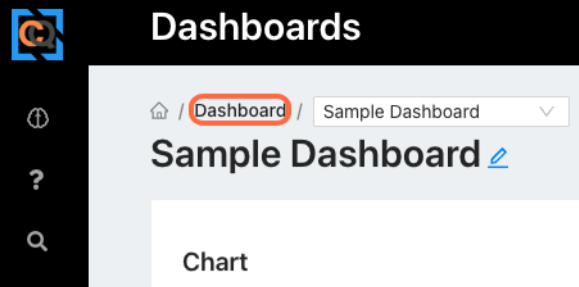
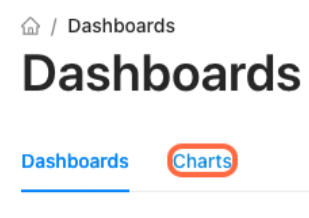
View all the charts you have access to by navigating to the Dashboard home page. The link to this page is right above the name of the dashboard you are currently viewing / right next to the house icon and to the left of the dashboard drop down.
Then navigate to the Chart Tab:
Step 1:
Step 2:
Task 10
Click into a specific chart by selecting the chart name - the user is now viewing the Chart Settings. Here you can see who has access to the chart, where the chart is being used, the comments associated with it, and if anyone is watching this chart.
Note: deleting or removing a chart is permanent.
Example:

Task 11
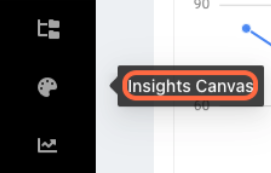
Navigate to Insights Canvas.
Note: the Insights Canvas homepage also provides access to the Charts Tab.
Step 1:
Task 12
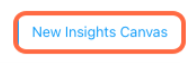
Create a new presentation by clicking "New Insights Canvas," provide a name and assign ownership rights:
Step 1:
Step 2:

Task 13
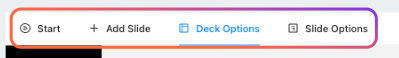
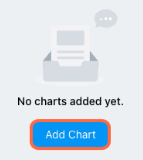
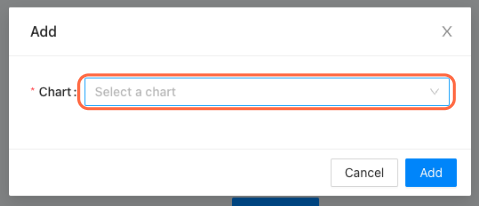
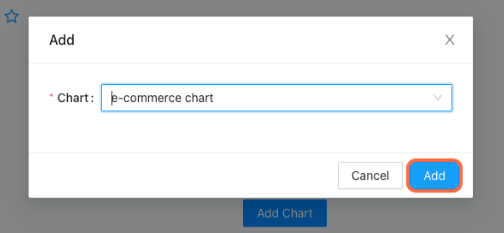
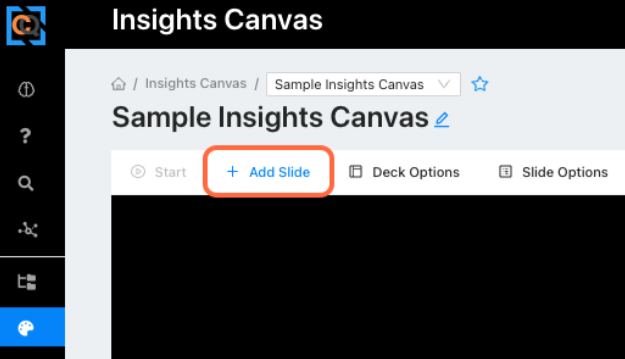
To start building out the presentation start by clicking the "+ Add Slide" button in the main menu. Each slide within Insights Canvas is based on a chart, next ClearQuery will prompt you to select the chart, click "Add."
Step 1:
Step 2:

Task 14
Each slide allows the user to add a title and description/analysis to accompany the chart.
Note: to create a title slide, add a new slide, select any chart, then click the "X" in the top right of the chart. This will leave you with a blank slide to add a title and introduction or date if you wish.
Example:

Task 15
Continue building out the presentation and exploring the Insights Canvas menu where the user can change the theme, toggle the ClearQuery branding, print to PDF, as well as, present the slides from within ClearQuery.
Example: